Friday, September 28, 2012

DE Sell Side Bias


MCD Target Hit "Marking The Spot Trade"


MCD completed it's 1st objective today. See the other links for more info "Marking the Spot"

Thursday, September 27, 2012

2T XOM

2T with confirmation

Wednesday, September 26, 2012

85.50 In the Cards for Crude / CL

CL Daily Chart

6E Futures Daily/Pulling into Support

6E Futures Daily Chart
6E Futures Daily Chart seeing a nice organized channel pullback into a confluence of support area's. The downward slopping trend-line from late February, the breakout level that occurred in early September off of the mid-June head 1.2759 should act as good support on a pullback. Note: the volume is cooperating also on this decline, nothing foolish nor scary as of yet about this pullback. IMO it gets bought up and we take another assault at the September highs of 1.3183 . If the head high of 1.2759 fails, it targets the mid July rising trend-line and the 1.2397 level where fresh bulls should defend, and put new capitol to work.

Tuesday, September 25, 2012

MCD Daily The "Confluence Cross" Marking the Spot

Today the "Confluence Cross", Marking the Spot in our last MCD post occurred and we saw $MCD put in a head fake above point #2 just to sucker in a few fresh longs but then to reverse to squeeze these new longs out of there positions. Now we are seeing a shift in pattern  and a 2 day key reversal bar unfolding. In the next coming sessions I expect $MCD to see continued weakness and selling pressure as this move targets $91 for its 1st objective and a break of $91 targets the lower extreme of the range.

Thursday, September 20, 2012

MCD Marking the "Spot"

MCD Marking the "Spot"... Watching for reversal pattern into point 4

Tuesday, September 18, 2012

Euro /6E Daily ...Extended, Setting up Negative

/6E Setting up on the Sell Side for Today's trade. Quit vertical also, reversion back to the mean due.

Friday, September 14, 2012

BA (Boeing) Daily Chart

Both support levels on BA have been holding, the major support level was clearly defended by the bulls and still has upside objective of 80.82 and the retracement pullback support level is getting a work out with multiple tests as the shorts attempt to break this area keeping the island reversal active by trapping the longs in the market who bought the island. With the uptrend line intact and acting as support, along with the support level and today's reversal candlestick, I wouldn't be surprised to see this stock reverse course and begin attacking the island head and attempt to pop the downward trend-line. Note: 77.56 objective is still active. 

Thursday, September 13, 2012

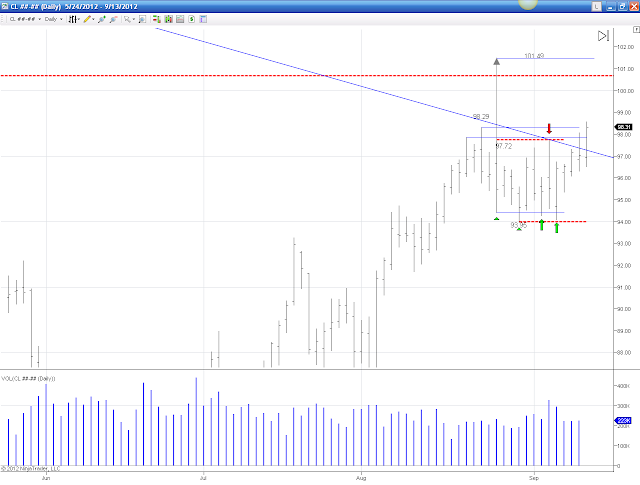
3 More Dollars Left In $CL_F

CL_F targeting 101.49 after hurdling its YTD downtrend line, 100.68 resistance

Wednesday, September 12, 2012

Gold Weekly Inverted Head & Shoulders Pattern

Gold $GC_F futures weekly chart has been testing its Key Reference Area (3) times since putting in 1923.70 highs from September of last year. In doing so, these (3) tests have created a large inverse head and shoulders bottoming pattern as the head was defended of may this year with a right shoulder low of 1526.70. After putting in a right shoulder low, this future made a move north to 1642.40 finding its 1st resistance. After finding the 1526.70 high/low saw a double bottom re-test in late June. Then a few months of consolidation this future was ready to breakout of its symmetrical triangle formation which targets 1758.10 which was a few points away from completing its short term upside move today. Note: smaller time-frames today are turning negative as the last 4 trading weeks look a little long in the tooth and vertical. Any pullback into the key 1642.40 area "high" I anticipate responsive buyers to be active (what was resistance now = support) , this also would be a healthy retracement needed to propel this future through the neckline and begin attacking its extremes highs of 1923.70 and then on the complete its ultimate objective of 2084.90

Gold / GC_F Futures Setting Up For Pullback ?


IBM Daily

IBM Daily is breaking out of a long term down trend line. But also bumping its head on rising trend-line which is resulting in a rising wedge pattern. Note the inverted head & shoulders pattern that's targeting the 213.00 price. On a pullback into 202-200.00 i anticipate buyers to be active on a re-test of the broken trend-line plus the August high as support.

30 Year Bond Head and Shoulders

The 30 Year Bond looks very toppy up at these levels. Trendline break/retest 123 trend change, with a larger head and shoulders setting up for a major downside target.

Wednesday, September 5, 2012

Emini S&P 500 Futures Daily Chart

test of 1424.75's coming, anticipating 1428.50's to complete and to squeeze shorts into new highs

Russell 2000

Russell 2000

Gold Weekly Chart

Gold Weekly - New support forming at 1600.00...1520 level acted as support as 3rd test formed ba (consolidation ) into area http://www.kratrader.com/2011/08/gold-got-parabolic-swing-trade-short.html